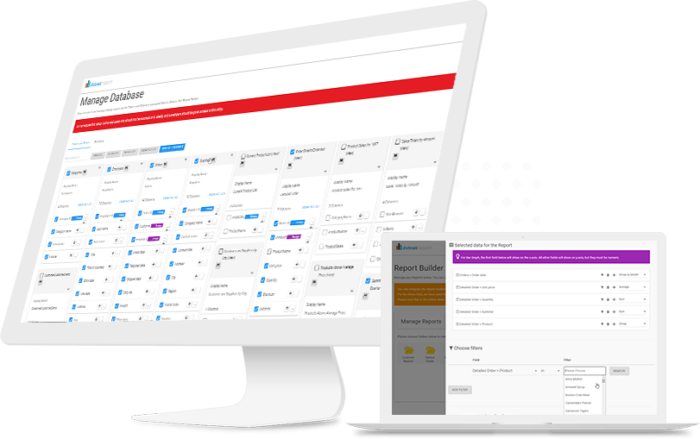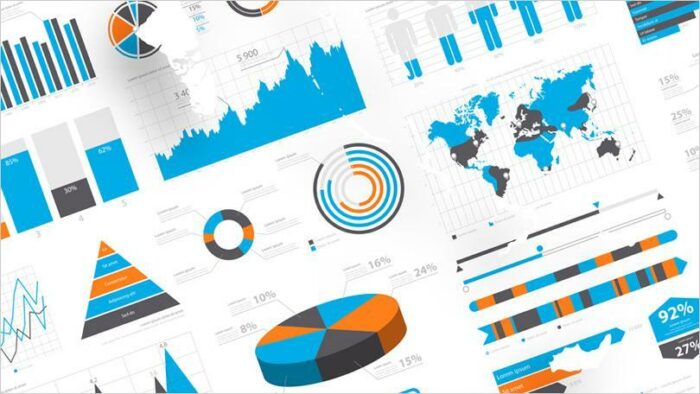
When diving into the world of SQL reports, the ability to craft captivating visualizations is tantamount to orchestrating an intricate dance between simplicity and complexity. A delicate balance must be struck, and striking it well is of the utmost importance. Within this article, we shall traverse the realm of designing eye-catching visualizations that not only convey the essence of your data but do so in a manner that’s both lucid and engaging. If you’re in search of a steadfast ally to accompany you on this journey, datapine’s smart SQL reporting stands ready to be your guiding light.

1. Choose the Right Chart Type
Selecting the appropriate chart type is the first step in designing an effective visualization. Here are some common chart types and their uses:
- Bar charts: For comparing discrete categories or data over time
- Line charts: For showing trends over time or continuous data
- Pie charts: For displaying percentages or parts of a whole
- Scatter plots: For identifying correlations between two variables
- Heatmaps: For showing data density or intensity
Think about the data you’re working with and select the chart type that best represents the information you want to convey.
2. Keep It Simple
An effective visualization should be easy to understand at a glance. Follow these guidelines to keep your visualizations simple and clean:
- Use minimalist design principles – less is more!
- Stick to a limited color palette to avoid overwhelming the viewer
- Avoid 3D effects or unnecessary decorations that may distract from the data
- Use clear labels and concise titles to guide the viewer through the visualization

3. Use Consistent Formatting
Consistency is key when it comes to designing visualizations for SQL reports. Here are some tips for maintaining consistency:
- Use the same font and font size across all visualizations in a report
- Choose a color scheme and stick to it throughout the report
- Apply the same formatting rules (e.g., gridlines, axis labels, legend placement) to all charts
Consistency not only makes your report look more professional, but it also helps viewers to understand and interpret the visualizations more quickly.
4. Optimize for Readability
Your visualizations should be designed with readability in mind. Follow these tips to ensure your charts are easy to read and understand:
- Use high contrast colors for text and background
- Select a legible font that is easy on the eyes
- Ensure text sizes are large enough to be read comfortably
- Use short, descriptive labels and avoid jargon

5. Tell a Story with Your Data
Effective visualization can be a powerful tool for communicating complex data and ideas in a clear and concise manner. However, creating a truly impactful visualization involves more than just presenting the data. In fact, the most effective visualizations are those that not only present data, but also tell a compelling story. Use these storytelling techniques to make your visualizations more engaging and informative:
- Highlight key insights by using annotations or emphasizing specific data points
- Use complementary visualizations to provide additional context or support for your main chart
- Arrange visualizations logically to guide the viewer through the story you’re trying to tell
- Consider using interactive elements (e.g., tooltips, filters, drill-downs) to allow viewers to explore the data more deeply
6. Leverage White Space Strategically
White space, or negative space, is the unoccupied area surrounding the elements of your visualization. It’s essential to use white space effectively, as it can improve readability and comprehension. Keep these tips in mind:
- Don’t overcrowd your visualizations with too much information
- Give charts, text, and other elements room to breathe by providing ample space between them
- Use white space to create visual hierarchy and guide the viewer’s eyes through the report

7. Adapt to Your Audience
Understanding your audience is crucial when designing visualizations for SQL reports. Consider the following when tailoring your charts and graphs to your viewers:
- Identify the key insights your audience needs to grasp from your report
- Use terminology and labeling that is familiar and accessible to your audience
- Choose visualization types that cater to your audience’s preferences or expectations
By adapting your visualizations to your audience, you’ll enhance their ability to comprehend the information presented.
8. Test and Iterate
Finally, always be prepared to test and refine your visualizations. Here’s how to ensure your visualizations are effective and well-received:
- Solicit feedback from colleagues, stakeholders, or other members of your audience
- Look for areas where viewers may struggle to understand the data or interpret the visualization
- Iterate on your design, making improvements based on the feedback received
By continuously testing and iterating on your visualizations, you can create SQL report visualizations that are not only visually appealing but also highly informative and engaging.

Benefits of Using Visuals in Reports
Using visuals in reports can provide a range of benefits that can help improve the effectiveness and impact of your communication. Here are some of the key benefits of using visuals in reports:
- Increases understanding
- Improves retention
- Enhances engagement
- Provides context
- Supports decision-making
Optimizing Visuals for Different Devices
Optimizing visuals for different devices is essential in today’s world where people access information on a range of devices, from smartphones to laptops and desktops. When designing visuals for different devices, it’s important to consider the screen size, resolution, and orientation of the device. For example, a visualization that looks great on a large desktop monitor may be difficult to read on a small smartphone screen.
To optimize visuals for different devices, you can use responsive design techniques that automatically adjust the layout and size of the visualization based on the screen size and orientation of the device. You can also consider creating multiple versions of the visualization that are optimized for different devices, or allowing users to customize the visualization based on their device preferences.
By optimizing visuals for different devices, you can ensure that your audience can access and engage with your information regardless of the device they are using.

Conclusion
In conclusion, designing effective visualizations for SQL reports requires a thoughtful and deliberate approach. By choosing the right chart type, keeping it simple, using consistent formatting, optimizing for readability, telling a story with your data, leveraging white space strategically, adapting to your audience, and testing and iterating on your designs, you can create visualizations that convey your data in a clear and engaging manner. Remember to consider the context and purpose of your report, and to always keep your audience in mind.


